In the digital age, data has become a powerful asset, driving insights that fuel innovation and guide strategic decisions. Effective Data Management and Analytics form the backbone of organizations seeking to harness the full potential of their data.
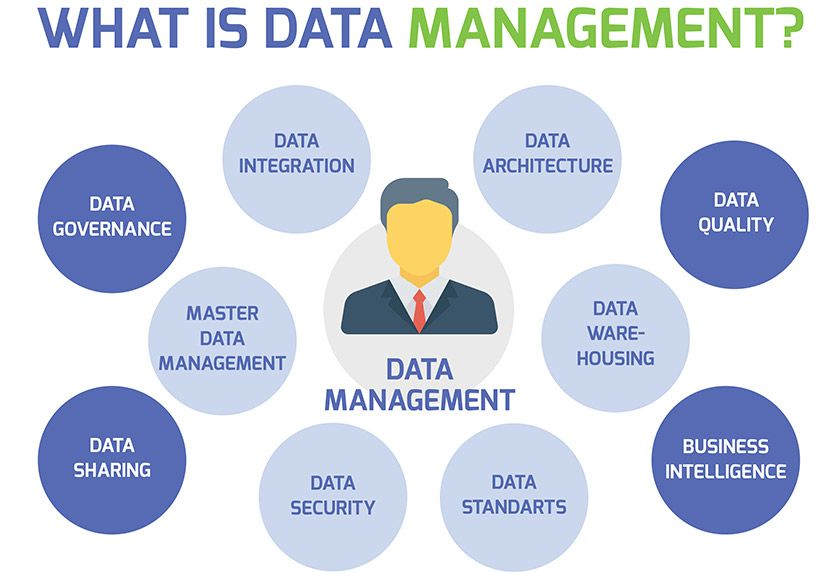
Data Management is a comprehensive set of practices, processes, and technologies designed to effectively acquire, organize, store, secure, and utilize data throughout its lifecycle. In the contemporary digital landscape, where data is a cornerstone of organizational success, robust data management strategies are critical for harnessing the full potential of information assets. Here's a breakdown of key components within the realm of Data Management:
1. Data Acquisition:
Collection from Diverse Sources: Data Management involves the systematic gathering of information from various sources, including databases, applications, sensors, and external APIs.
Ingestion Processes: Establishing efficient mechanisms for ingesting and importing data into a centralized repository.
2. Data Organization and Storage:
Database Architecture: Designing and implementing database structures that cater to the specific needs of the organization.
File Systems and Data Warehouses: Choosing appropriate storage solutions for structured and unstructured data, ensuring accessibility and scalability.
3. Data Quality Management:
Cleansing and Validation: Implementing processes to ensure data accuracy and reliability by identifying and rectifying errors and inconsistencies.
Standardization: Establishing data standards to maintain uniformity and consistency across the entire dataset.
4. Master Data Management (MDM):
Single Source of Truth: Creating a unified and consistent version of master data, reducing redundancy and improving overall data accuracy.
Governance and Security: Implementing policies and procedures to control access to master data and ensure its integrity.
5. Data Security and Privacy:
Access Control: Restricting access to sensitive data based on user roles and permissions.
Compliance: Adhering to data protection regulations and industry standards to safeguard against unauthorized access and maintain data privacy.
6. Data Lifecycle Management:
Archiving and Purging: Managing data throughout its lifecycle by archiving historical information and purging outdated or irrelevant data.
Retrieval and Retrieval Policies: Ensuring that data is readily available when needed and establishing policies for data retrieval.
7. Metadata Management:
Cataloging and Tagging: Organizing and labeling data with metadata to provide context and facilitate easy discovery.
Lineage Tracking: Tracing the origin and transformation of data, aiding in data quality assessment.
8. Data Governance:
Policies and Standards: Defining and enforcing policies and standards for data usage, ensuring compliance and accountability.
Stakeholder Collaboration: Involving stakeholders across the organization to collectively contribute to data governance and decision-making.
9. Data Integration:
ETL Processes: Extracting, transforming, and loading data from diverse sources into a unified view for analysis.
Real-time Integration: Enabling the analysis of data as it is generated for timely decision-making.
Conclusion: Data Management is an essential discipline that empowers organizations to transform raw data into a strategic asset. In an era where data is abundant and diverse, effective Data Management ensures that organizations can navigate, harness, and derive valuable insights from the vast ocean of information at their disposal.
CRM (Customer Relationship Management)
Elevating Connections, Driving Success
In the realm of modern business, where customer-centricity is paramount, Customer Relationship Management (CRM) stands as a powerful strategy and technology combination aimed at cultivating and optimizing interactions between a company and its clientele. At its core, CRM is not merely a software solution but a comprehensive approach that encompasses processes, methodologies, and tools designed to enhance customer satisfaction, loyalty, and overall business performance.
1. Centralized Customer Database:
Holistic Customer View: CRM consolidates customer data from various touchpoints, providing a unified and comprehensive view of each customer's interactions, preferences, and history.
Contact Information and Communication History: Detailed records of customer contact information, communications, and transactions are stored in a centralized database for quick reference and personalized engagement.
2. Customer Interaction Tracking:
Communication History: CRM systems track and archive all interactions with customers, including emails, phone calls, meetings, and support requests.
Notes and Annotations: Users can add notes and annotations, fostering seamless collaboration among team members and ensuring a consistent customer experience.
3. Sales Force Automation:
Lead Management: CRM facilitates the tracking and management of leads, from initial contact through the sales pipeline.
Opportunity Management: Users can monitor and manage sales opportunities, ensuring a systematic approach to closing deals.
4. Marketing Automation:
Campaign Management: CRM systems support the planning, execution, and analysis of marketing campaigns, helping organizations reach and engage their target audience.
Lead Nurturing: Automation features enable the nurturing of leads through personalized content and communication.
5. Customer Support and Service:
Ticketing System: CRM provides a centralized system for logging and resolving customer issues, ensuring efficient customer support.
Knowledge Base: Users can access a knowledge base to provide quick and accurate responses to customer inquiries.
6. Analytics and Reporting:
Performance Metrics: CRM systems offer analytics and reporting tools to track key performance indicators, measure the effectiveness of sales and marketing efforts, and identify areas for improvement.
Forecasting: CRM assists in sales forecasting by analyzing historical data and trends, providing insights into future revenue expectations.
7. Mobility and Accessibility:
Mobile Compatibility: CRM solutions often offer mobile applications, allowing users to access customer information and manage interactions on the go.
Cloud-Based Options: Many CRM systems are cloud-based, ensuring accessibility and collaboration across diverse locations and devices.
8. Integration Capabilities:
Third-Party Integrations: CRM platforms seamlessly integrate with other business applications, such as email, calendars, and accounting software.
APIs and Customization: CRM systems often provide APIs and customization options, allowing businesses to tailor the platform to their specific needs.
Conclusion: CRM is a dynamic and indispensable tool for organizations seeking to forge lasting connections with their customers. By centralizing customer data, streamlining processes, and fostering collaboration across teams, CRM empowers businesses to not only understand their customers but also to anticipate their needs, cultivate loyalty, and drive sustainable growth in today's competitive business landscape.
Unlocking Data Potential with ETL (Extract, Transform, Load)
Introduction: In the dynamic landscape of data-driven decision-making, businesses rely on robust and efficient data integration processes to extract valuable insights from a myriad of sources. ETL, which stands for Extract, Transform, Load, plays a pivotal role in this data journey, serving as the backbone for seamless data flow and transformation.
1. Understanding ETL: ETL is a comprehensive process that involves extracting raw data from diverse sources, transforming it into a structured and usable format, and loading it into a destination where it can be effectively analyzed. This three-step approach ensures that data is not only collected but also refined and organized for meaningful interpretation.
2. The Extract Phase: In the extraction phase, data is gathered from various sources, such as databases, logs, applications, or external APIs. ETL tools facilitate this process by efficiently pulling data from these disparate sources, ensuring a consistent and reliable inflow of information.
3. The Transform Phase: Transforming raw data into a usable format is a critical step in the ETL process. This phase involves cleaning, enriching, and structuring the data to meet specific business requirements. Transformation can include data cleansing, validation, aggregation, and even the creation of new variables, ensuring that the data is accurate, consistent, and ready for analysis.
4. The Load Phase: After the data has been extracted and transformed, it is loaded into a target system, typically a data warehouse, database, or a data lake. This phase ensures that the refined data is stored in a structured manner, ready for reporting, analysis, and visualization.
5. Benefits of ETL: a. Data Quality Improvement: ETL processes enhance data quality by cleaning and standardizing information, reducing errors and inconsistencies. b. Improved Decision-Making: Access to well-organized and accurate data empowers organizations to make informed decisions, driving business success. c. Time and Cost Efficiency: Automation of data integration tasks through ETL tools significantly reduces the time and resources required for manual data handling. d. Scalability: ETL processes can scale to handle large volumes of data, ensuring that as businesses grow, their data infrastructure remains robust and efficient.
6. ETL Tools: Various ETL tools are available to streamline and automate the ETL process, including popular choices such as Apache NiFi, Talend, Informatica, and Microsoft SSIS. These tools provide user-friendly interfaces, drag-and-drop functionalities, and robust connectors to simplify the complexity of data integration.
Conclusion: In the era of big data, ETL emerges as a crucial component for organizations striving to harness the full potential of their data. By extracting, transforming, and loading data efficiently, businesses can unlock valuable insights, foster innovation, and stay competitive in an increasingly data-driven world. ETL is not just a process; it's a key enabler for organizations seeking to make data a strategic asset in their journey towards success.
Visualization
In the era of big data, where information is abundant and complex, Visualization emerges as a transformative tool, converting raw data into a compelling narrative. It is the art and science of presenting data in graphical or visual formats, making complex information more accessible, understandable, and actionable. Visualization goes beyond mere aesthetics; it is a strategic approach to unveiling patterns, trends, and insights that might be hidden within the data.
1. Representing Data Graphically:
Charts and Graphs: Visualization leverages various graphical elements, such as bar charts, line graphs, pie charts, and scatter plots, to represent data points and relationships intuitively.
Maps: Geospatial data comes to life through maps, providing a geographical context for insights and patterns.
2. Enhancing Data Understanding:
Pattern Recognition: Visualization allows for the swift identification of patterns, trends, and outliers in large datasets, facilitating a deeper understanding of the underlying information.
Correlation and Relationships: Relationships between variables become apparent, aiding in the discovery of connections that might not be immediately evident in raw data.
3. Storytelling with Data:
Narrative Visualization: Through the strategic arrangement of visual elements, data becomes a story. Visualization transforms data points into a compelling narrative that guides decision-makers through a coherent and impactful journey.
Timeline Visualization: Events and trends unfold chronologically, providing a temporal context that is crucial for understanding historical patterns or predicting future developments.
4. Interactive Visualization:
Dashboards: Interactive dashboards empower users to explore and interact with data dynamically, customizing their experience and focusing on specific aspects of interest.
Filters and Drill-Downs: Users can drill down into specific data subsets or apply filters to tailor the visualization to their unique needs.
5. Business Intelligence (BI) and Analytics:
KPI Dashboards: Key Performance Indicators (KPIs) are visually represented to provide a quick overview of business performance.
Predictive Analytics Visualization: Complex predictive models are simplified through visual representations, making it easier for stakeholders to grasp future trends and possibilities.
6. Tools and Technologies:
Data Visualization Tools: Platforms like Tableau, Power BI, and D3.js provide user-friendly interfaces for creating interactive and insightful visualizations.
Augmented Reality (AR) and Virtual Reality (VR): Emerging technologies are pushing the boundaries of data visualization, offering immersive experiences for deeper engagement.
7. Decision Support and Strategy:
Informed Decision-Making: Visualization acts as a decision support tool, providing stakeholders with a visual context that aids in more informed and timely decision-making.
Strategy Communication: Complex strategies and plans are communicated effectively through visual representations, ensuring clarity and alignment across teams.
Conclusion: Visualization is the bridge between raw data and actionable insights, transforming information into a language that resonates with individuals across various domains. In an age where data complexity continues to grow, the ability to create meaningful visualizations becomes a powerful skill for those seeking to extract value, communicate effectively, and make informed decisions in a data-driven world.